
Snowpack — Bansko (model)Experimental
- Current season
- Season 2025/26
Calculated snowpack for seven places in the Bansko area, Pirin: the study plot at 2220 m and six places on Todorka, Chashata, Djamdjievi skali and Palashitsa. For each place the SNOWPACK model (WSL SLF) builds the snowpack layer by layer from the start of the season. Archive of the 2025/26 season, recalculated with the same model. Not updated.
On 08.05.2026
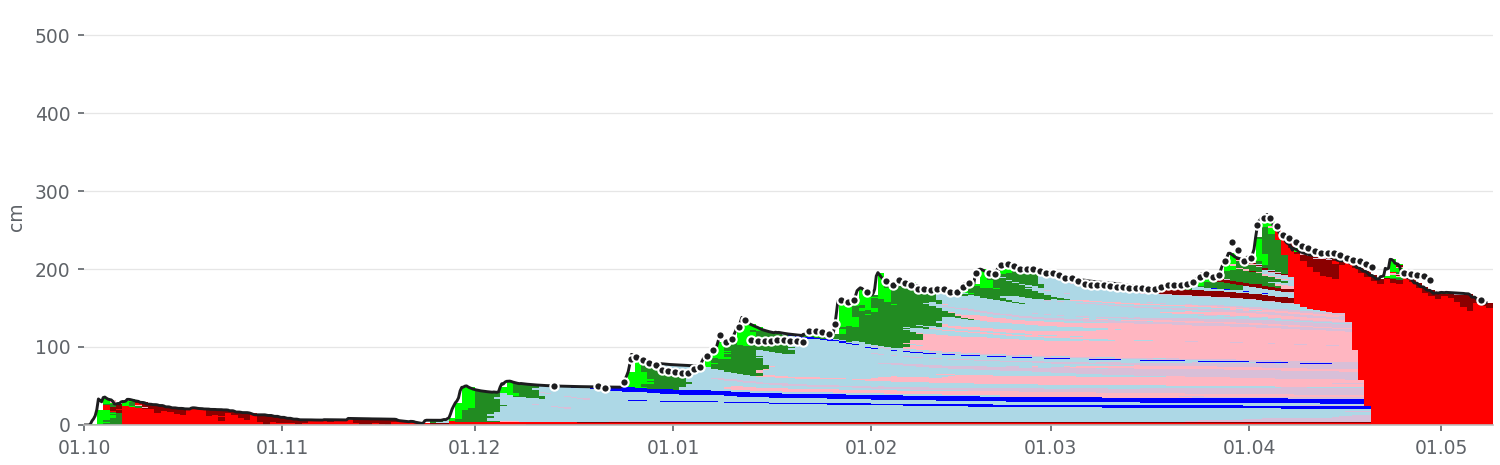
- Study plot157 cm−3 cm in 24 hSurface: Melt-freeze crust (MFcr)
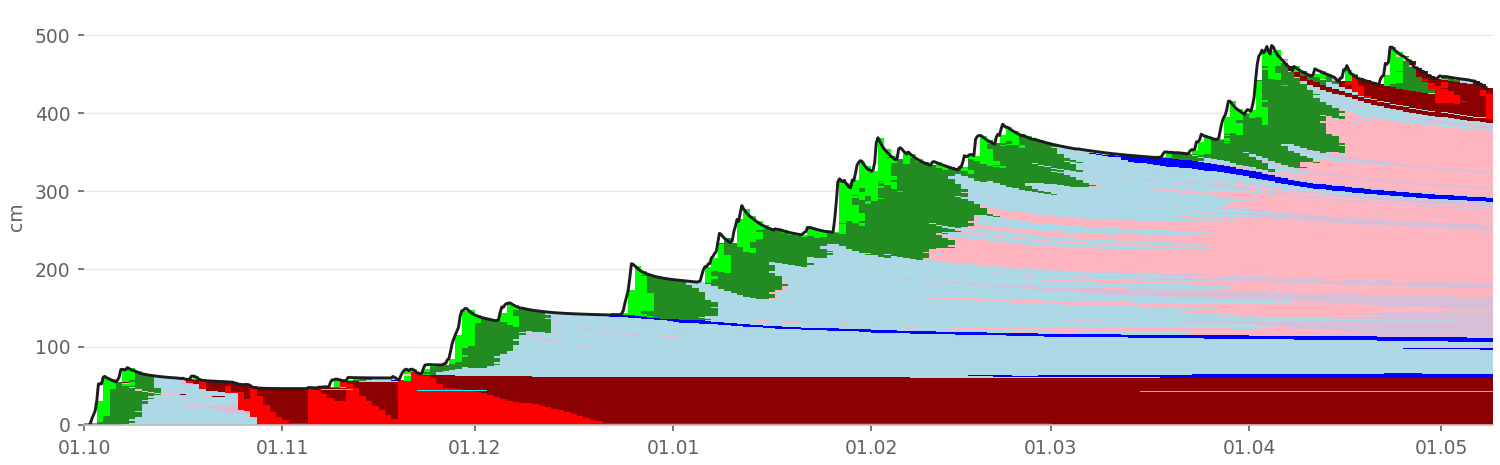
- Todorka north face433 cm−5 cm in 24 hSurface: Melt-freeze crust (MFcr)
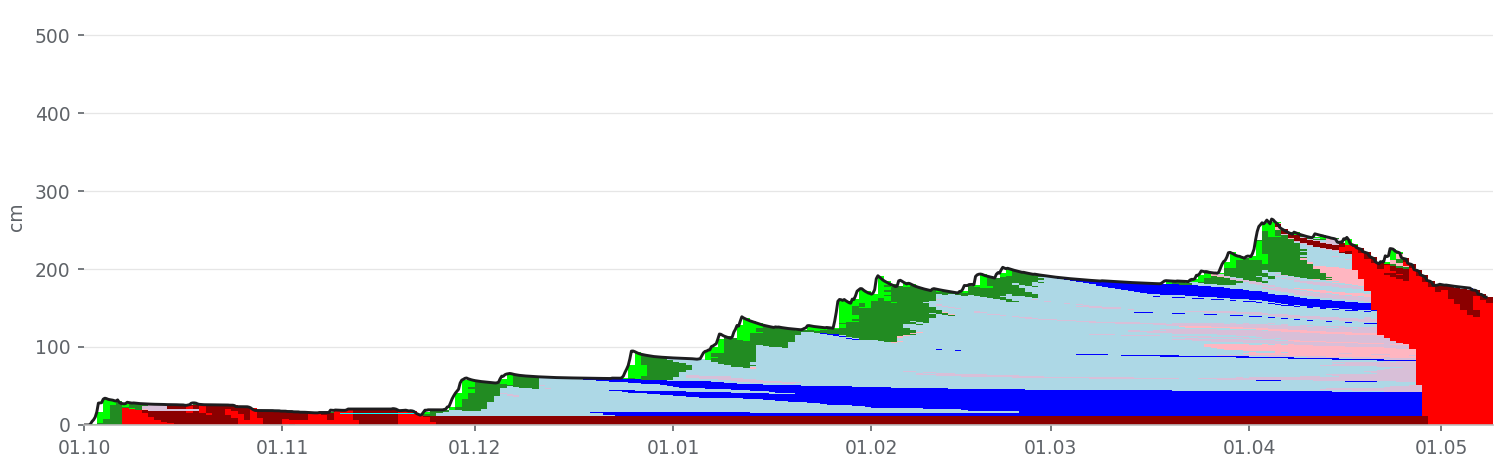
- Todorka west face164 cm−4 cm in 24 hSurface: Melt-freeze crust (MFcr)
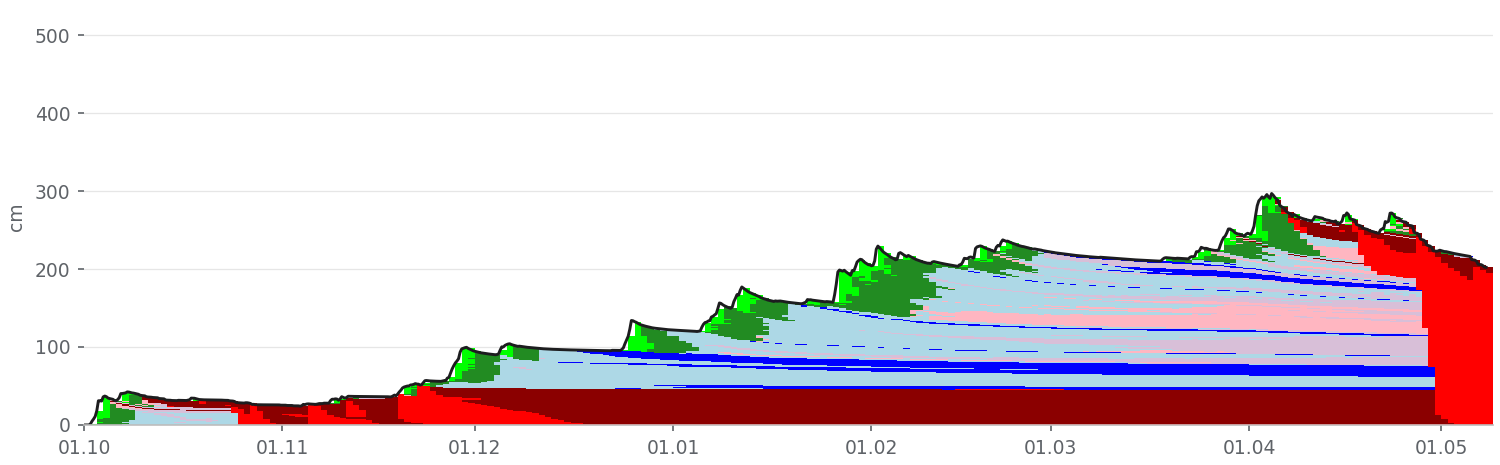
- Todorka south slopes202 cm−4 cm in 24 hSurface: Melt-freeze crust (MFcr)
- Chashata295 cm−4 cm in 24 hSurface: Melt-freeze crust (MFcr)
- Djamdjievi skali263 cm−4 cm in 24 hSurface: Melt-freeze crust (MFcr)
- Palashitsa275 cm−3 cm in 24 hSurface: Melt-freeze crust (MFcr)
Calculated on 18.10.2026 11:59 for the season from 01.10.2025 to 08.05.2026.
- PP — Precipitation particles
- DF — Decomposing and fragmented particles
- RG — Rounded grains
- FC — Faceted crystals
- FCxr — Rounding faceted particles
- DH — Depth hoar
- SH — Surface hoar
- MF — Melt forms
- MFcr — Melt-freeze crust
- IF — Ice formations
The colours are the grain types in each layer, the line is the snow depth, and the dots on the study plot chart are the measured snow depth. Explanations below the charts.
Study plot
Todorka north face
Todorka west face
Todorka south slopes
Chashata
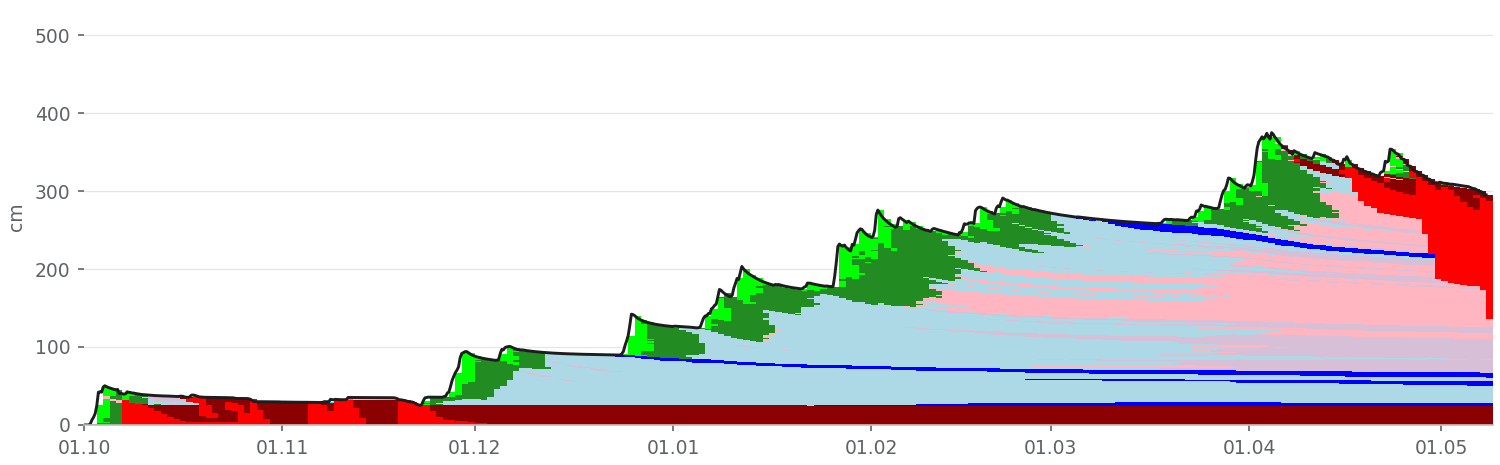
Djamdjievi skali
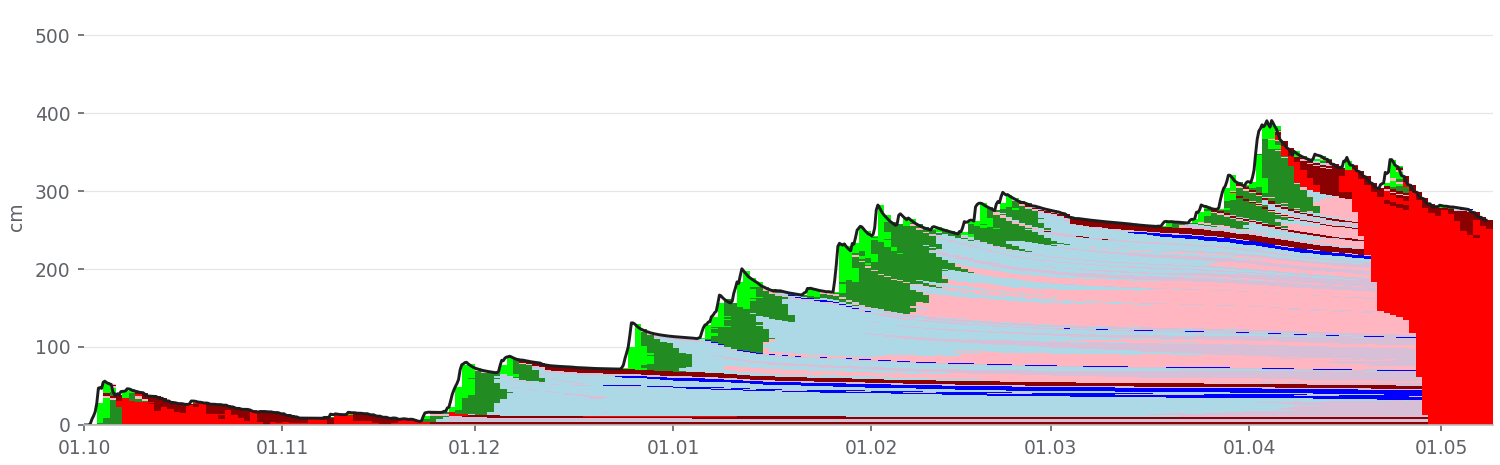
Palashitsa
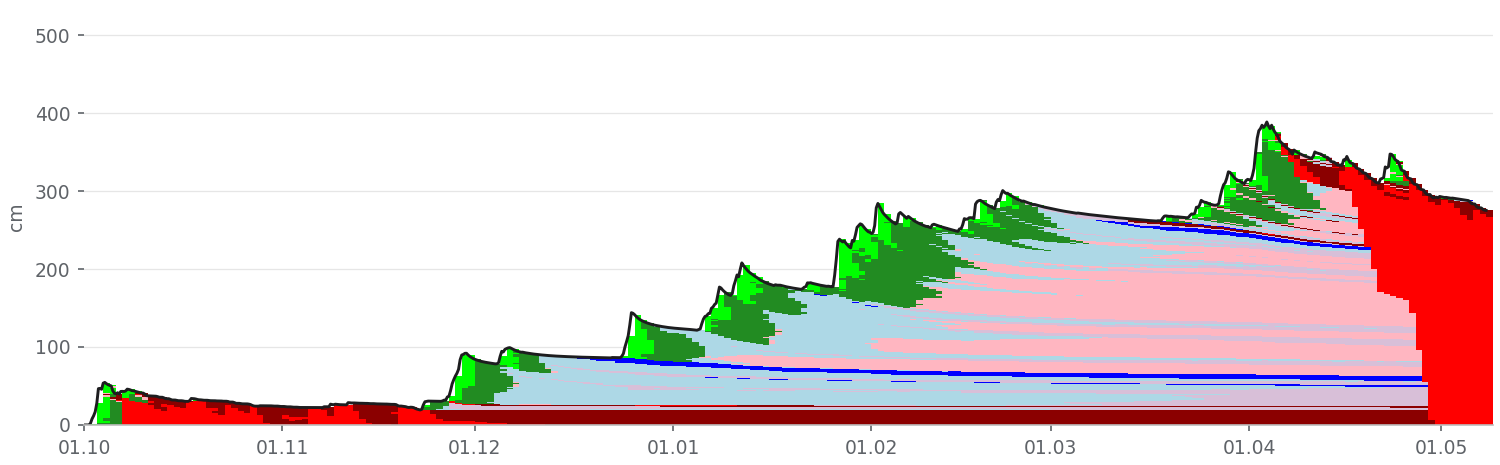
How it is calculated
Weather: Open-Meteo data for each place's grid square: temperature, humidity, wind, precipitation, solar radiation. There are no automatic weather stations nearby.
Study plot correction: at each reading the snowfall since the previous one is scaled up or down until the calculated snow depth matches the measured one. The same correction applies to all places, with 5 % more precipitation per 100 m above the plot, and holds until the next reading. Readings: 123 (13.12.2025 – 07.05.2026).
Each place is calculated with its own elevation, aspect and slope angle, so the layers differ from place to place.
How accurate it is
For the 2025/26 season the calculated snow depth at the study plot differs from the measured one by 3.5 cm on average, and the 24 h new snow by 1.7 cm. There are no measurements on the slopes to compare with; the values there are less certain.
How to read the charts
Each chart shows the season day by day. The colours are the grain types in each layer (international classification, see below), the line is the snow depth, and the dots on the study plot chart are the measured snow depth. Surface hoar (SH), faceted crystals (FC) and depth hoar (DH) buried by new snow are the typical weak layers. The model shows where they may be; whether they are a weak layer has to be checked in the field.
⚠ Disclaimer
We encourage you to make your own observations and not rely solely on this information, as any forecast is generalized and in certain cases may be inaccurate or incomplete. We are not responsible for actions in the mountains that may lead to harm, damage, or death as a result of avalanche incidents.